
In the competitive pharmaceutical and biotechnology industries, where robust patent portfolios are essential for protecting innovative biologics and enabling successful biosimilar development and market entry, securing favorable outcomes at the USPTO is paramount. Patent allowance rates in pharmaceutical and biotechnology art units reveal that large pharmaceutical companies significantly outperform smaller competitors at the USPTO.
Given the acute importance of patent portfolios to pharmaceutical and biotechnology companies, we examined allowance rates of utility patent applications within the USPTO Art Units 1600* (covering relevant organic chemistry and biotechnology inventions) from January 2019 to February 2026. Our analysis, drawn from the USPTO’s publicly available Patent File Wrapper API, focuses on a sample of twelve of the largest pharmaceutical companies by size that are publicly traded in the U.S. and compared their performance with all applicants within the same time window and art units.
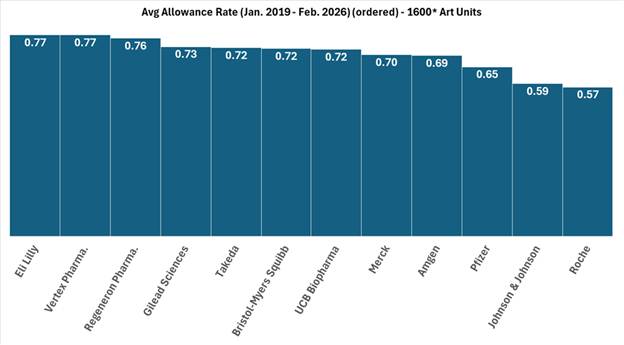
FIG. 1: Illustration of average allowance rate of twelve large pharmaceutical company applicants within the 1600* art units from January 2019 to February 2026.
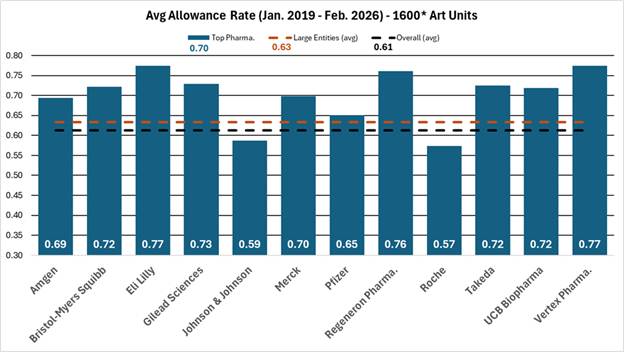
FIG. 2: Comparison of average allowance rate of twelve large pharmaceutical company applicants to all applicants and large entity status applicants within the 1600* art units from January 2019 to February 2026.
As shown in Figures 1 and 2, the blue bars depict the average allowance rate for each respective company where the allowance rate is calculated as the number of total allowances divided by the number of total disposed cases (i.e., allowances and abandonments).[1] In Figure 1, the pharmaceutical companies are ordered from highest (left) to lowest (right) allowance rate. In Figure 2, the dashed orange line represents the average allowance rate (63%) of large entity status applicants, and the dashed black line represents the average allowance rate (61%) of all applicants. Many of these top pharmaceutical companies exceed the average allowance rate of all applicants and even surpass the large entity average. The average allowance rate of the twelve sampled large pharmaceutical companies was 70%.
These results show that most large pharmaceutical companies significantly outperform smaller pharmaceutical and biotechnology patent applicants regarding application allowances. Interestingly, the large pharma average allowance rate is skewed downwards by significantly below average allowance rates of 57% and 59% by Johnson & Johnson and Roche, respectively. Overall, the large pharma group’s average allowance rate is notably higher than the 61% average for all applicants and the 63% average for all large entities, which includes the sampled large pharma companies, within the same art units and time period.
A recent analysis comparing the prosecution outcomes of applicants based on their entity status found that large entities (e.g., businesses with greater than 500 employees) significantly outperformed small and micro entities [1]. The analysis considered utility patent applications disposed during January 2026. Our analysis further highlights the outperformance of large pharmaceutical companies compared to smaller competitors.
Disclaimer: The information contained in this posting does not, and is not intended to, constitute legal advice or express any opinion to be relied upon legally, for investment purposes or otherwise. If you would like to obtain legal advice relating to the subject matter addressed in this posting, please consult with us or your attorney. The information in this post is also based upon publicly available information, presents opinions, and does not represent in any way whatsoever the opinions or official positions of the entities or individuals referenced herein.
[1] Data available at https://api.uspto.gov/api/v1/patent/applications/search via the Patent File Wrapper API, and collected using a bespoke MATLAB script.